GA4 Ecommerce Tracking: The Metrics Every Store Needs to Know
September 29, 2026
This is the point where the vast majority of GA4 ecommerce tracking guides conclude: with instructions for setting up the purchase event. While the purchase event is necessary to set up, it doesn’t really tell you much. The main difference between Universal Analytics and the GA4 is that the former relies on the hit-based model while GA4 is based on the event-driven data model. Therefore, it is possible to track each important ecommerce moment as a separate event instead of a preset report. Unlike the UA hit-based model, this approach allows tracking ecommerce events, but it also means that you need to build the metrics on your own. In this guide, we will describe the default ecommerce events tracked by the GA4 as well as the metrics that are usually missing from GA4 reports and the reporting pitfalls that are usually not addressed in generic GA4 tutorials.
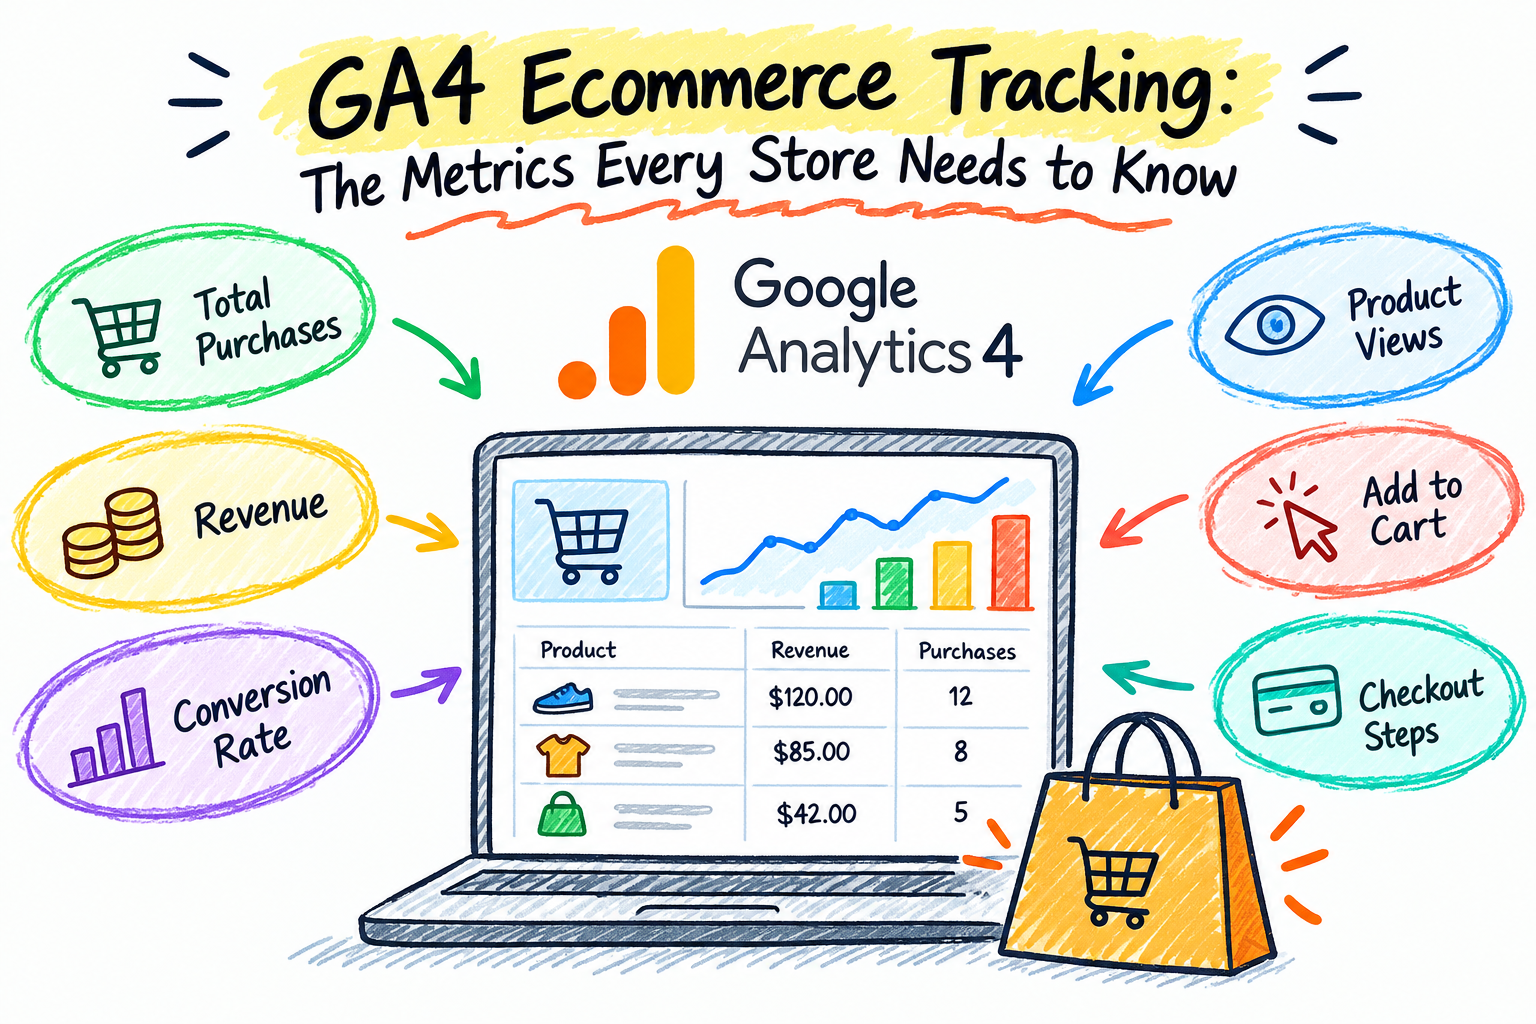
Core ecommerce events captured by GA4.
Events which GA4 recommends are in line with the customer journey. If these events are not firing correctly, no other downstream metrics can be relied on.
view_item – the product page is viewed
add_to_cart – the product is added to the cart
view_cart – contents of the shopping cart have been looked at
begin_checkout – the checkout process has started
add_shipping_info / add_payment_info – those are the steps of the checkout process
purchase – transaction occurred
Each of these events requires some set parameters to be reportable — at the minimum, currency, value, and items array with item_id and item_name for each product for events like add_to_cart; GA4 requires currency, value, and items array with at least item_id and item_name for each product. The most common reason ecommerce reports in GA4 appear to be incomplete or inconsistent is because the parameters are not included — the events get fired, but the underlying data is too sparse to produce meaningful metrics.
Metrics Not Provided by GA4
This is where most introductory material fails to cover anything at all: GA4 comes without any of a number of metrics that Universal Analytics provided automatically. For instance, GA4 lacks an automatic ecommerce conversion rate or cart abandonment rate. Any store that takes GA4 ecommerce tracking seriously has to create these metrics themselves using Calculated Metrics in Explorations:
| Metric | Formula | What it reveals |
| Overall Conversion Rate | Transactions ÷ Total Sessions | Baseline store performance across all traffic |
| Cart-to-Purchase Rate | Purchases ÷ Add-to-Cart Events | Checkout flow effectiveness |
| Cart Abandonment Rate | (Add-to-Cart − Purchases) ÷ Add-to-Cart | Friction specifically in the post-cart journey |
| Average Order Value (AOV) | Total Revenue ÷ Number of Transactions | Pricing and upsell performance over time |
| Revenue Per User | Total Revenue ÷ Number of Users | Identifies high-value segments and channels |
In order to create them, one must select Explore > Blank, and then add dimensions such as Date, Source/Medium, or Device Category and purchase and revenue metrics such as Ecommerce Purchases and Purchase Revenue, and then add the calculated metrics. Otherwise, one cannot get the ratios that show how good the funnel is. Otherwise, a store will be analyzing only the number of events, but not their ratio, which determines if the funnel is healthy.
GA4 Revenue Undercounting: GA4 is known to regularly undercount revenue by a notable amount – often up to 5–15%. The problem is that GA4 is affected by ad blockers and consent rejections. In other words, GA4 undercounts the store’s revenue due to 5 to 15 percent because of ad blockers and consent rejection. GA4 revenue reporting is more about being aware of limitations than trying to find a solution, so you must always rely on it as an indicative trend rather than the sole source of information.
Channel concentration and internal traffic contamination: Stores normally attract traffic from 8–12 channels but generate 70–80% of their revenues from three or four. Yet, reporting that considers all channels as being equal in their value and attempts to optimize them all is a complete waste of time spent on traffic sources which could not have driven revenue in the first place. In addition to that, internal traffic — the traffic coming from the very employees who work in the store themselves and browse its site — can secretly make up 5-15% of total sessions in smaller stores, which is more than enough to mess up the conversion rate and overall channel performance unless internal traffic is blocked using the internal traffic filters of GA4.
Instead of analyzing individual events on their own, the proper order for a weekly analysis is as follows:
This Is Particularly Important for Growth in Larger Catalogs
Each of these issues becomes worse as more products and sales channels are added to the store. A one-channel store that sells 50 products will often be able to get away with just tracking raw purchases. A multi-channel store that sells many more products will not be able to do this; each of the above problems will become significant enough to influence real decisions like where to allocate advertising budgets and how to prioritize their catalogs. This is part of the reason why growth-oriented ecommerce stores have started to develop an analytics layer as part of the platform, rather than leave it up to merchants to create custom GA4 reports themselves — Idiocom, for example, has built their analytics layer with the intention of surfacing such performance data.
GA4 ecommerce tracking provides stores with much finer insights than Universal Analytics, but most key metrics indicating store health are not provided pre-built. Store owners should correctly set up the metrics, such as cart abandonment, true conversion rates and revenue per user. Besides, they should pay attention to revenue undercounting and channel concentration. Store owners who utilize GA4 as a reporting basis that can help them create specific metrics are able to get useful insights. Stores that merely look at event counts are not provided with all necessary information.
Why is GA4 not able to calculate ecommerce conversion rates like UA?
Unlike UA, GA4 is based on an event-driven data collection platform and did not incorporate many standard UA metrics, so it relies on stores to define their own calculated metrics instead.
Is it normal to experience a revenue difference of between 5 and 15 percent from GA4 and my store system?
Yes. A gap, to a certain degree, is normal and is usually the result of the presence of ad blockers and consent-based data tracking refusal. You should keep an eye on possible discrepancies, but if the gap remains stable, there is no malfunction in the system.
Should I equally divide my marketing budget among all the marketing channels?
In most cases, marketing spending should not be equal across all channels, as the majority of stores make their money with only a few of them and hence would benefit from concentrating their funds and their efforts there instead of distributing them among all the channels.
What are good ways to test ecommerce events?
One method is to use GTM Preview mode for things like add_to_cart, begin_checkout, and purchase to check that the events have fired and confirm that full parameters have been received.
What’s the most neglected part of GA4 ecommerce setup?
Filtering of internal traffic is probably the most neglected part. Once it is done, the issue rarely gets revisited and causes a problem with conversion rates and channel reports of the business.