Dashboard & Analytics
Track sales, customers, products and conversions from one powerful dashboard.
See Your Store Performance at a Glance
Idiocom brings your key store data into one analytics dashboard so you can understand what is happening, where sales are coming from and how customers are moving through your store. Track performance across sales, orders, customers, products and conversions without switching between different reports.
What You Can Monitor
- Overview – Get a quick view of overall sales, orders, customers and store performance.
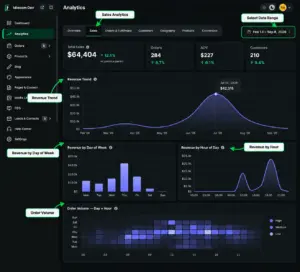
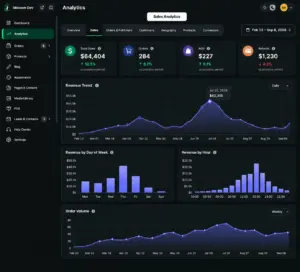
- Sales – Understand revenue trends, payment methods and when your store performs best.
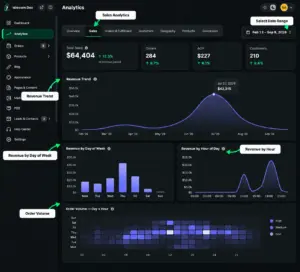
- Orders & Fulfilment – Track order activity and fulfilment performance.
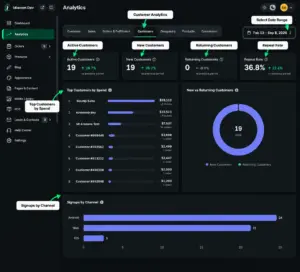
- Customers – See new and returning customers, spending patterns and sign-up channels.
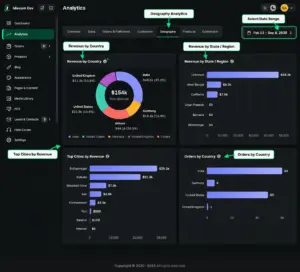
- Geography – Identify countries, regions and cities generating sales and orders.
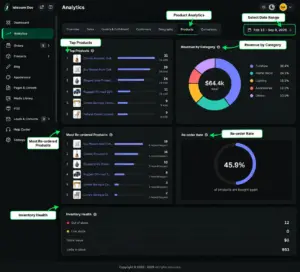
- Products – Find your best-selling and most re-ordered products and monitor inventory health.
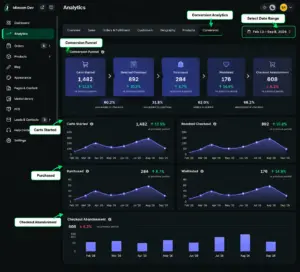
- Conversion – Follow the customer journey from cart activity to checkout and purchase.
Why It Matters
Instead of relying on guesswork, merchants can use these insights to spot opportunities, understand customer behaviour and make better day-to-day decisions. Whether you want to improve conversions, focus on your strongest products or understand where your customers are coming from, the data is available in one place.
Quick Steps
- 1 Dashboard
- 2 Analytics
- 3 Choose a report
- 4 Select date range
- 5 Review insights
Tip: Check your analytics regularly rather than only when sales drop. Small changes in products, customers or conversion behaviour can reveal useful opportunities early.